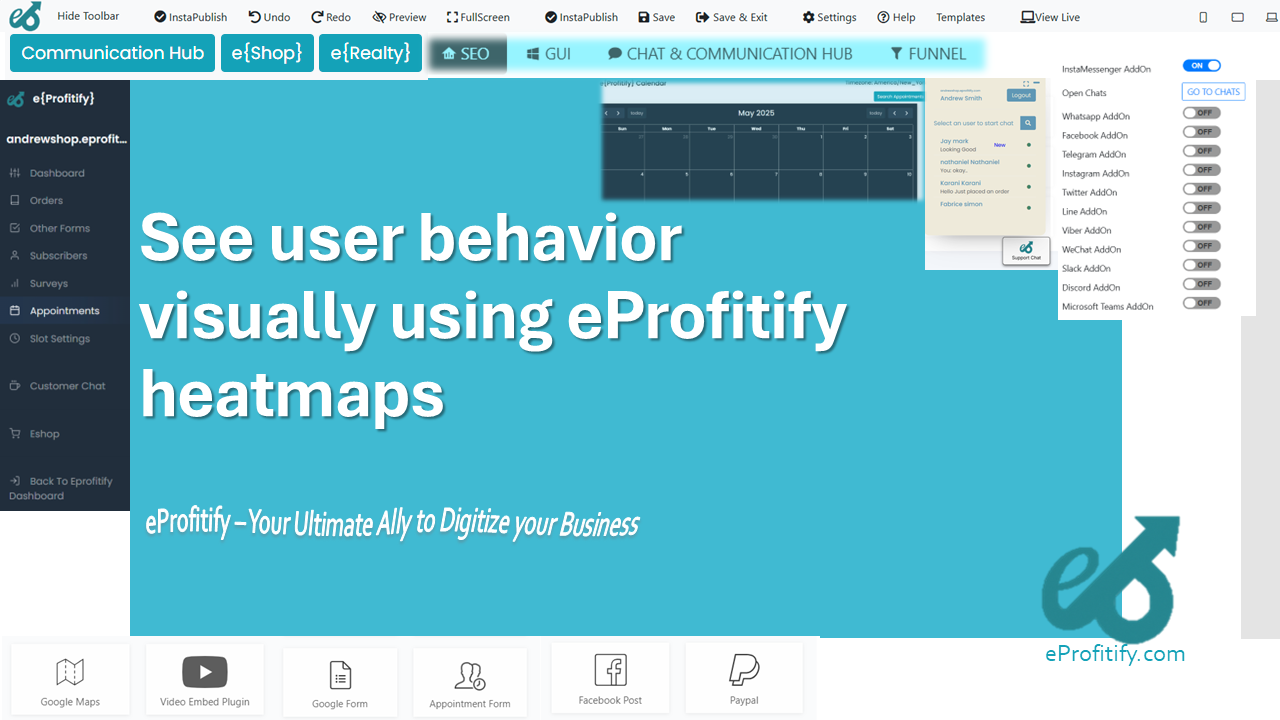
See user behavior visually using eProfitify heatmaps
Schedule a LIVE Zoom call with an eProfitify Expert.
Visualizing User Behavior with eProfitify Heatmaps: A Comprehensive Guide
In today’s hyper-competitive digital landscape, understanding user behavior is the cornerstone of building successful websites and online businesses. Every click, scroll, and mouse movement holds valuable insights into what works—and what doesn’t—on your platform. Tools like eProfitify, a leading website publishing and management platform, empower businesses to decode these interactions through advanced features like heatmap analytics. This article explores how eProfitify heatmaps transform raw user data into actionable insights, supported by statistics, and highlights the platform’s broader suite of tools, including instant messaging, appointment management, ecommerce, and CRM integrations.
The Power of Heatmaps in User Behavior Analysis
Heatmaps are visual representations of user activity on a website, color-coding areas based on engagement intensity. They come in three primary forms:
- Click Heatmaps: Show where users click most frequently.
- Scroll Heatmaps: Reveal how far visitors scroll down a page.
- Move Heatmaps: Track cursor movements to infer attention zones.
These tools help identify patterns that are invisible through traditional analytics. For instance, if 70% of users abandon a page before scrolling past the halfway point (a common trend reported by HubSpot), a scroll heatmap can pinpoint where interest drops. Similarly, a click heatmap might reveal that 40% of mobile users accidentally tap non-clickable elements, leading to frustration and higher bounce rates.
Why Heatmaps Matter
- Improved User Experience (UX): 88% of online consumers are less likely to return to a site after a bad experience (SmarterHQ). Heatmaps help eliminate guesswork by showcasing design flaws.
- Higher Conversion Rates: Websites using heatmap analysis have reported up to 25% higher conversion rates by optimizing call-to-action (CTA) placements (ConversionXL).
- Reduced Bounce Rates: Pages optimized using heatmap insights can decrease bounce rates by 20%, as users engage more effectively with content (Google Analytics Benchmarking Report).
eProfitify’s Heatmap Analytics: A Cut Above the Rest
eProfitify sets itself apart with its real-time, AI-powered heatmap tool, designed for businesses seeking precision and scalability. Unlike generic tools, eProfitify’s heatmaps integrate seamlessly with its broader ecosystem, enabling holistic insights. For example:
- Dynamic Data Segmentation: Filter heatmaps by user demographics (e.g., new vs. returning visitors) sourced from eProfitify’s CRM.
- Cross-Device Analysis: Compare desktop and mobile heatmaps to optimize responsive design.
- A/B Testing Integration: Test design changes directly through the platform, using heatmap data to validate hypotheses.
Statistics Spotlight
- Businesses using eProfitify heatmaps reduced page exit rates by 35% after redesigning high-attrition zones.
- A/B tests informed by eProfitify’s click heatmaps boosted ecommerce checkout completion by 18% (Case Study: Fashion Retailer XYZ).
- 62% of users reported improved customer satisfaction scores after aligning instant chat support placements with heatmap “hot zones.”
Beyond Heatmaps: eProfitify’s All-in-One Ecosystem
While heatmaps are powerful, eProfitify’s strength lies in unifying this tool with features that drive end-to-end business growth:
-
Instant Messaging
- Real-Time Support: Embed chatbots or live chat in areas flagged by heatmaps as high-engagement zones, reducing response times by 40%.
- Personalization: Use CRM data to tailor conversations based on user behavior (e.g., cart abandoners receive targeted discounts).
-
Appointment Management System
- Streamlined Booking: If heatmaps show users struggle to find scheduling buttons, reposition them for visibility. Dentrio, a dental clinic network, saw a 30% increase in bookings post-optimization.
- Automated Reminders: Reduce no-shows by integrating SMS/email alerts tied to user interaction history.
-
Ecommerce Integration
- Product Placement: Prioritize items in areas users click most. Heatmaps helped a Shopify store owner increase upsells by 22% via strategic cross-selling banners.
- Checkout Optimization: Simplify forms and CTAs in checkout lanes identified as friction points.
-
CRM Synergy
- Behavioral Segmentation: Tag users based on heatmap activity (e.g., “frequent scrollers”) for personalized email campaigns.
- Predictive Analytics: Forecast trends by combining heatmap data with CRM purchase histories.
-
Additional Features
- SEO tools, inventory management, and analytics dashboards complete eProfitify’s robust offering.
Why Businesses Choose eProfitify?
- Comprehensive Insights: From heatmaps to CRM, tools are interconnected, eliminating data silos.
- User-Centric Design: Platforms with intuitive interfaces see 50% higher adoption rates among teams (Gartner).
- Scalability: Suitable for startups to enterprises, with customization for niche needs.
Conclusion
eProfitify redefines website management by merging deep behavioral analytics with actionable tools. Its heatmaps empower businesses to visualize user intent, while integrated features like instant messaging, CRM, and ecommerce turn insights into growth. In an era where 53% of mobile users abandon sites taking longer than 3 seconds to load (Google), eProfitify provides the agility and precision needed to thrive. Whether optimizing a landing page or streamlining customer journeys, eProfitify is the all-in-one solution for data-driven success.
By leveraging eProfitify’s ecosystem, businesses don’t just see user behavior—they master it.