Using Heatmaps to Understand User Behavior on Your Website
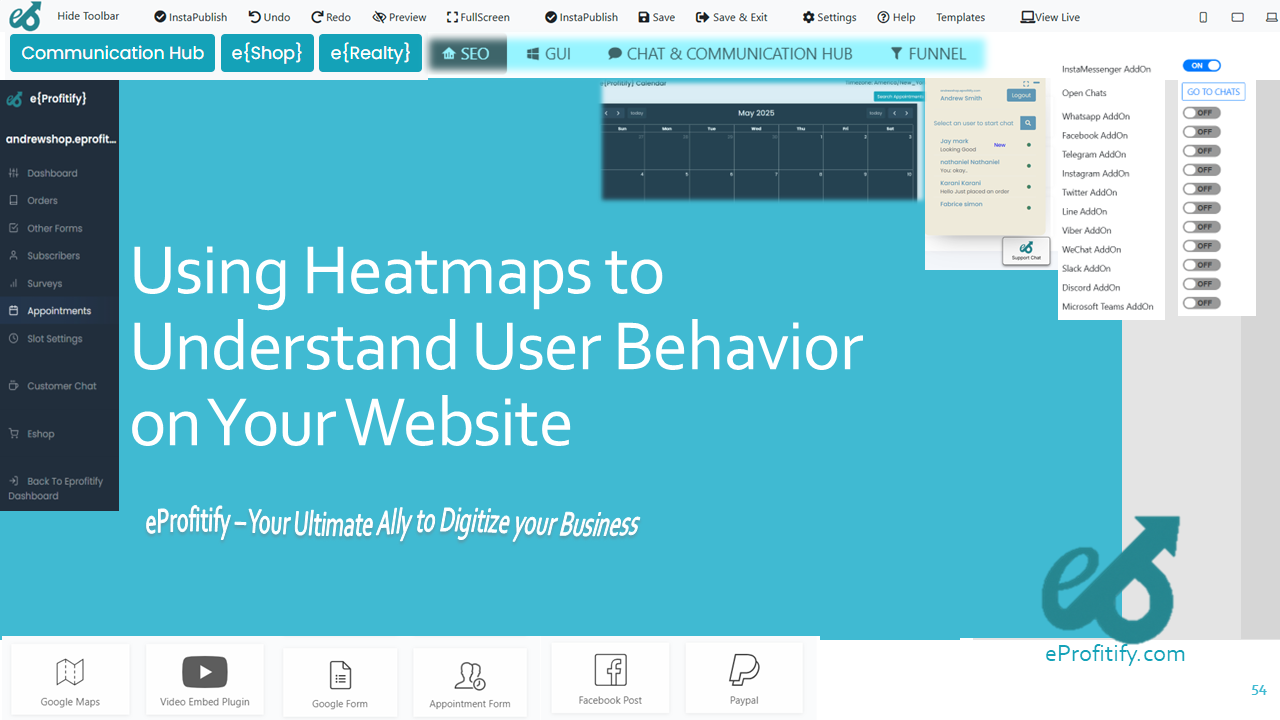
Using Heatmaps to Understand User Behavior on Your Website
In the digital age, understanding user behavior is pivotal for optimizing website performance. With 88% of online consumers less likely to return after a poor experience (Forbes), leveraging tools like heatmaps becomes essential. This article explores how heatmaps decode user interactions, supported by statistics, and highlights eProfitify—a leading website management platform that integrates heatmap analytics with CRM, ecommerce, and more to drive business success.
What Are Heatmaps?
Heatmaps visualize user activity through color-coded overlays, revealing clicks, scrolls, and cursor movements. They come in three primary types:
- Click Heatmaps: Track where users click, highlighting popular links or unnoticed CTAs.
- Scroll Heatmaps: Show how far users scroll, identifying content engagement thresholds.
- Move Heatmaps: Map cursor movements, correlating with gaze patterns (Nielsen Norman Group estimates 88% correlation between cursor and eye movement).
Why Heatmaps Matter: Statistics & Benefits
- Conversion Optimization: Websites using heatmaps report up to 30% higher conversion rates (HubSpot).
- Content Engagement: 60% of users never scroll past the fold; scroll heatmaps help prioritize content above this threshold (Chartbeat).
- Navigation Insights: 80% of clicks occur in the top-left quadrant (Jakob Nielsen), aiding layout adjustments.
Practical Applications of Heatmaps
- A/B Testing: Compare page versions. For instance, Crazy Egg found heatmap-driven redesigns boosted sign-ups by 25%.
- CTA Optimization: Identify ignored buttons. A retail site reduced bounce rates by 15% by relocating CTAs using click data.
- Mobile Usability: With 58% of traffic mobile (Statista), heatmaps ensure responsive design efficacy.
Case Study: Heatmaps in Action
An ecommerce brand used scroll maps to discover only 40% of users viewed product descriptions. By repositioning key specs above the fold, conversions rose by 22%. Tools like eProfitify streamline such analyses by integrating heatmaps with sales data, enabling precise adjustments.
eProfitify: A Comprehensive Solution
eProfitify emerges as a leader in website management, offering heatmap analytics alongside tools that amplify insights:
- Instant Messaging: Live chat interactions can be analyzed via heatmaps to optimize support triggers.
- Appointment Management: Track booking widget engagement to streamline scheduling.
- Ecommerce Integration: Heatmaps identify product page bottlenecks, boosting sales when paired with inventory analytics.
- CRM Synergy: Link user behavior to customer profiles for personalized marketing, enhancing retention by up to 35% (Aberdeen Group).
Addressing Challenges
While heatmaps offer invaluable insights, challenges like data overload and privacy must be navigated. eProfitify mitigates these with GDPR-compliant tracking and AI-driven recommendations, focusing on actionable data.
Conclusion
Heatmaps are indispensable for decoding user behavior, driving conversions, and refining UX. Platforms like eProfitify elevate this by embedding heatmaps within a suite of tools—from CRM to ecommerce—creating a holistic ecosystem for data-driven decisions. In a competitive digital landscape, integrating such tools isn’t just advantageous; it’s essential for sustained growth.
By harnessing heatmaps and eProfitify’s unified platform, businesses can transform raw data into strategic action, ensuring every click, scroll, and hover fuels their success.

.png)